Debug
SOL provides a series of debug and visualization features.
Code Debugging
SOL’s generated code can be debugged by setting:
sol.config["jit::debug"]=True
And then device specific debuggers such as gdb or cuda-gdb can be used.
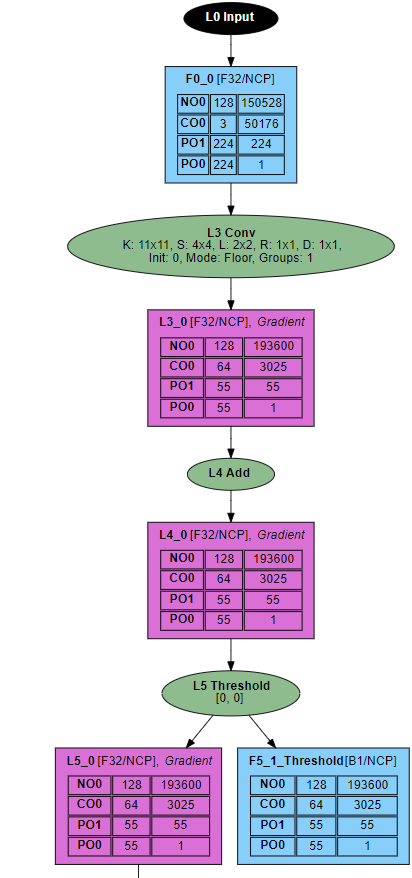
Computation Graph
sol.config["compiler::debug"]=True
plots the input CG, and a separate CG for every device and execution pass.
sol.config["compiler::debug_params"]=True
adds also parameter and copy nodes to the output. All plots are in SVG format and stored in $CWD/.sol/debug.
sol.config["compiler::name"]="string"
can be used to assign a name to the debug output.
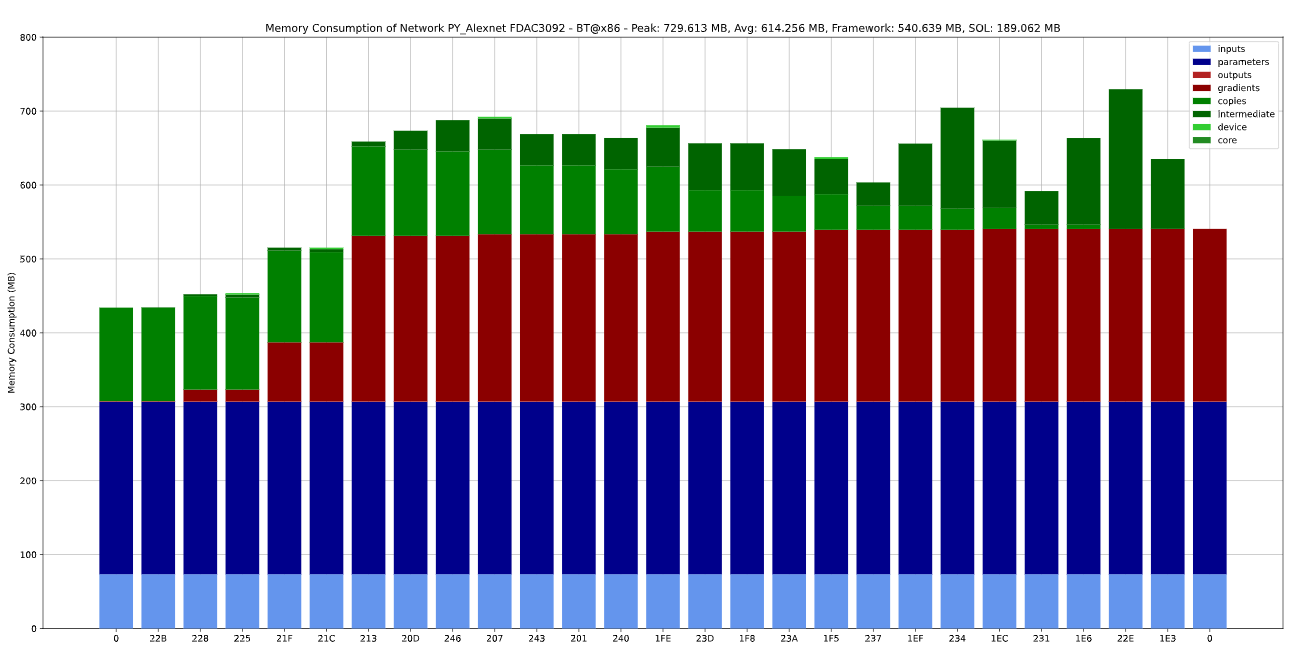
Memory Consumption
sol.config["compiler::debug_memory_consumption"]=True
plots the memory consumption for all devices and execution passes in $CWD/.sol/debug/*_memory.svg.
Colors:
- Blue: Fully managed by framework
- Red: Allocated by SOL, freed by framework
- Green: Fully managed by SOL
Labels:
- inputs: Model inputs
- parameters: Model parameters
- outputs: Model outputs
- gradients: Model gradients (only backward pass)
- copies: Data shared between forward and backward pass in training
- intermediate: Data shared between SOL fused layers
- device: Temporary data stored in device main memory during execution of fused layer
- core: Temporary data stored per core during execution of fused layer