Debug
SOL provides a series of debug and visualization features.
Code Debugging
SOL’s generated code can be debugged by setting:
sol.config["jit::debug"] = True			# compiles with debug symbols
sol.config["compiler::debug"] = True	# adds assertions into the code (requires jit::debug)
Python based frameworks
For Python based frameworks you can then execute the following series of commands:
gdb python3
run myscript.py
or run interactively
gdb python3
run
# starting from here the Python console will be active.
# use CTRL+C to switch back to GDB
import framework
import sol
model = init_model()
sol_model = sol.optimize(...)
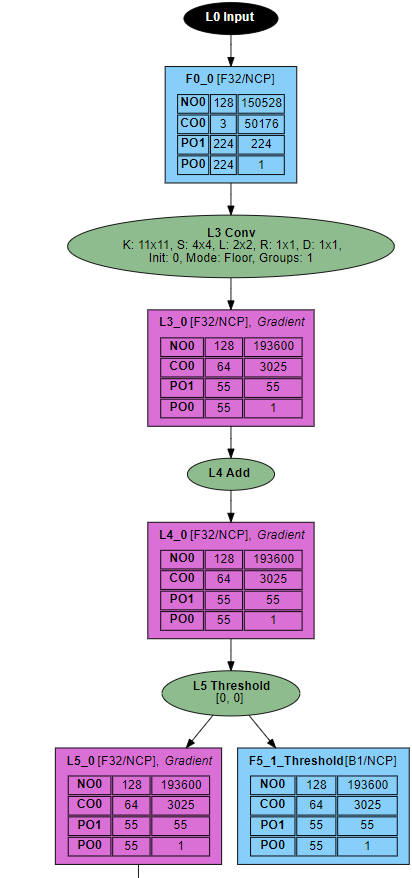
Computation Graph
| Option | Description |
|---|---|
sol.config["compiler::debug_graph"]=True |
Plots the input CG, and a separate CG for every device and execution pass. |
sol.config["compiler::debug_text"]=True |
Generates a textual representation of your computation graph, in case your graph is too complex. |
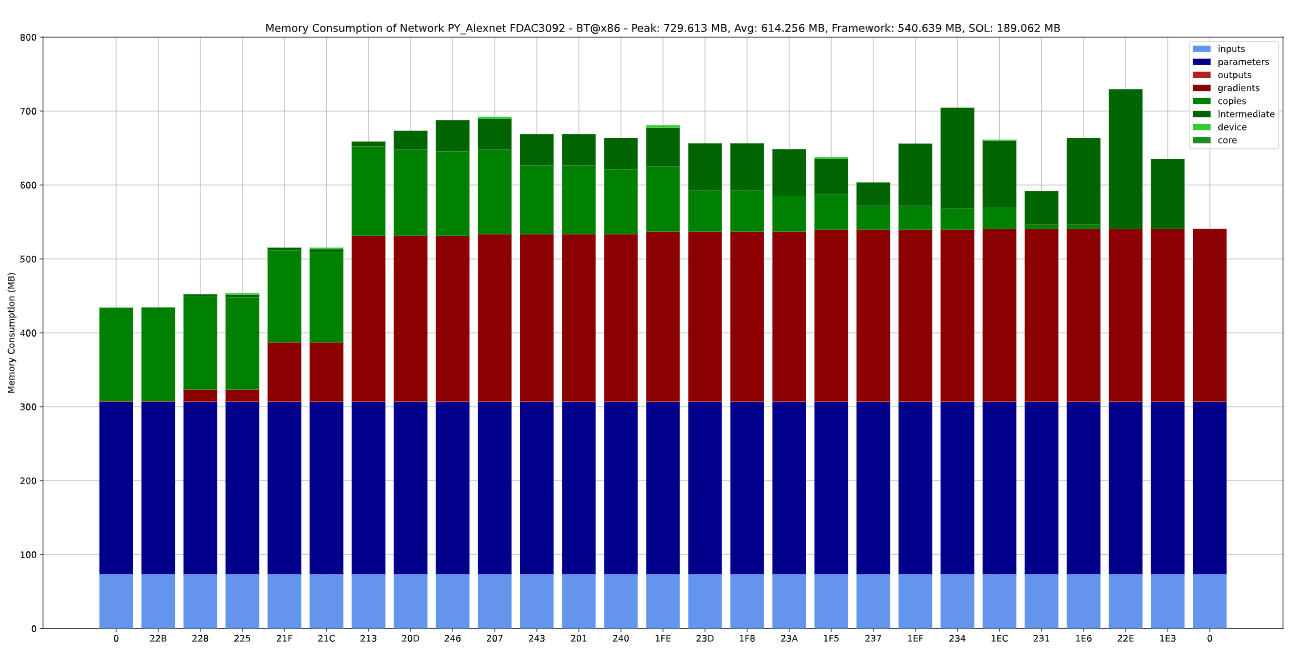
Memory Consumption
sol.config["compiler::debug_memory_consumption"]=True
plots the memory consumption for all devices and execution passes in $CWD/.sol/debug/*_memory.svg.
Colors:
- Blue: Fully managed by framework
- Red: Allocated by SOL, freed by framework
- Green: Fully managed by SOL
Labels:
- inputs: Model inputs
- parameters: Model parameters
- outputs: Model outputs
- gradients: Model gradients (only backward pass)
- copies: Data shared between forward and backward pass in training
- intermediate: Data shared between SOL fused layers
- device: Temporary data stored in device main memory during execution of fused layer
- core: Temporary data stored per core during execution of fused layer