Profiler
SOL comes with it’s own profiler to record performance and memory information.
tl;dr;
SOL_PROFILE=TRUE SOL_CLEAR_CACHE=TRUE python3 ...
Output Modes
SOL supports four output modes.
TRUE: Prints a formatted tabled directly in the console.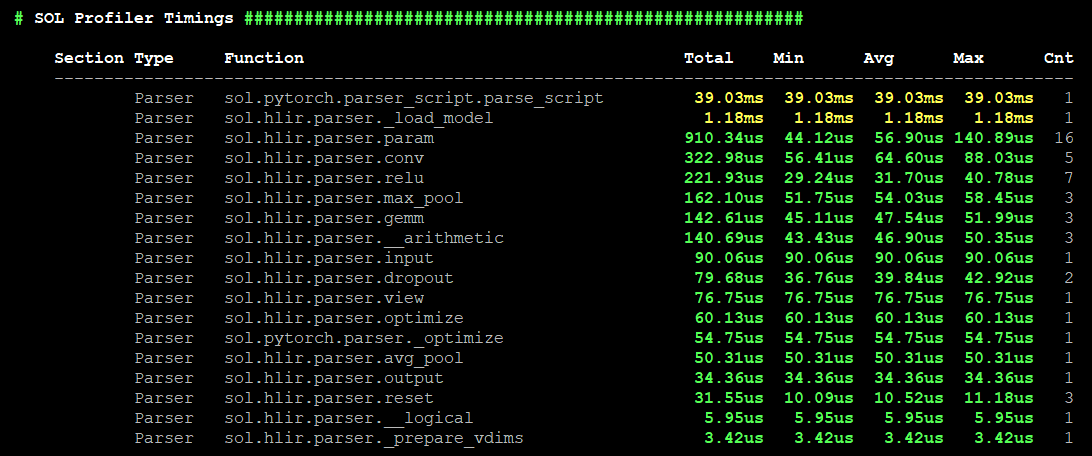
CSV/TSV: Prints a CSV or TSV formatted table in the console.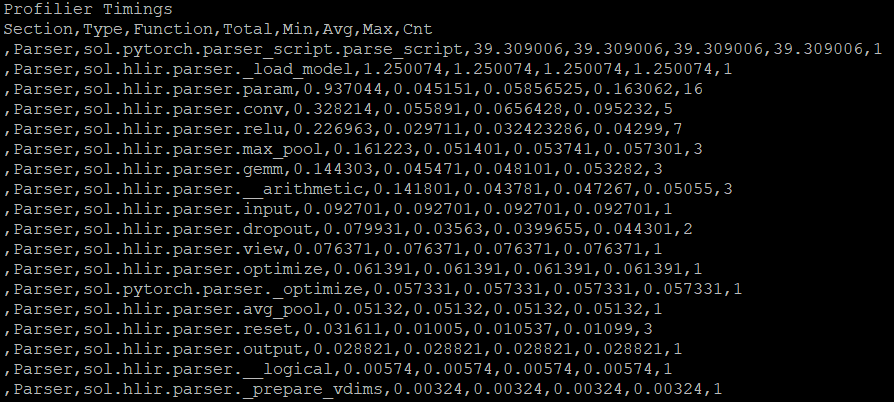
TENSORBOARD: Outputs the profiling to TensorBoard (experimental)
Performance and/or Memory Profiling
SOL can measure the performance and memory consumption throughout the execution.
By default, both get measured. You can set SOL_PROFILE={MODE}:{METRICS}, where
{METRICS} can be ALL, PERFORMANCE or MEMORY.
Redirect to file
To redirect the output to a file, or specify the TensorBoard output file, you
can set SOL_PROFILE={MODE}:{METRICS}:{FILENAME}.
Annotating your own code with SOL profiler API calls
In Python you can use:
with sol.profiler(sol.profiler.{TYPE}):
	...
In C/C++ you can use:
sol_profiler_push(SOL_PROFILER_{TYPE});
...
sol_profiler_pop();
SOL distinguishes the following profiling types:
- Parser: any code related to parsing models
- Compiler: any code related compiling
- Runtime: any code related to SOL’s runtime system
- Control: code that executes the control plane of SOL
- Device: code that executes computations on the devices (e.g. GPU kernels)
- H2D: time spend in copying data from host to device
- D2H: time spend in copying data from device to host
- Extern: any external profiling API calls
Profiler Sections
If you want to group your code into sections, e.g., “preprocessing”, “training”,
… you can use sol.profiler.section("SECTION_NAME", sol.profiler.{TYPE}, sol.profiler.{TYPE}) to define a section name, and to limit the profiler types
that shall be recorded for this section. If you call the function a second time,
it will create a new section.
Framework Specific Profiler integration
PyTorch (Experimental)
For PyTorch, SOL supports to extract PyTorch profiler calls into SOL’s profiler output. You can use:
with sol.pytorch.profile(*args, **kwargs):
	...
args and kwargs get redirected to torch.profiler.profile(*args, **kwargs).
When the with block terminates, SOL with catch all profiling events from
PyTorch and add them SOL’s profiler API.